Abstract
The aim of this study was to compare three methods of processing thermographic images for the evaluation of carpal temperature in healthy calves. Additionally, we sought to evaluate the thermal symmetry between the contralateral carpi of these calves. Thermographic images were obtained from both carpi of eight healthy calves aged between 20 and 45 days with a mean weight of 38.65 ± 2.27 kg. Using GRAYESS® IRT Analyzer 7 software, the total temperature (Ttot), region-of-interest temperature (Troi), and maximum mean temperature (Tmax) were determined. There was no difference between the temperatures obtained by the Ttot and Troi methods. Tmax showed higher temperatures (p < 0.01) than the other methods. The three image processing methods showed high and significant positive correlations for the temperature of the right and left carpi of healthy calves. Tmax presented a higher correlation coefficient (r = 0.99) than the two other methods, which suggests a greater sensitivity for identifying thermal variations among the contralateral carpi. The 99% confidence interval for the difference between the temperatures of the right and left carpi (∆r-l) was between 0.03 and 0.26°C; thus, a temperature variation within that range does not refer to pathologic processes.
Key words:
cattle; joint; thermal symmetry; thermography
Resumo
Este estudo objetivou comparar três métodos de processamento de imagens termográficas na avaliação da temperatura do carpo de bezerros saudáveis. Adicionalmente, buscou-se avaliar a simetria térmica entre os carpos contralaterais desses bezerros. Foram obtidas imagens termográficas de ambos os carpos de oito bezerros, hígidos, com idade entre 20 e 45 dias e peso médio de 38,65 ± 2,27 kg. As imagens foram analisadas por meio do software GRAYESS® IRT Analyzer 7, que possibilitou a obtenção da temperatura total (Ttot), temperatura da região de interesse (Troi) e temperatura máxima média (Tmax). Não houve diferença entre as temperaturas obtidas pelos métodos Ttot e Troi. O Tmax mostrou temperaturas mais elevadas (p < 0,01) em comparação aos demais métodos. Os três métodos de processamento de imagens apresentaram correlações elevadas e significativas para a temperatura dos carpos direito e esquerdo de bezerros saudáveis, entretanto, o Tmax apresentou maior coeficiente de correlação (r = 0,99), o que sugere maior sensibilidade para identificação de variações térmicas entre os carpos contralaterais. O intervalo de confiança de 99% para a diferença de temperaturas entre os carpos direito e esquerdo (∆d-e) foi de 0,03 a 0,26ºC, o que indica que a variação de temperatura dentro desse intervalo não remete a alteração patológica.
Palavras-chave:
articulação; bovino; simetria térmica; termografia
Introduction
Septic arthritis is a common cause of lameness in calves. When not treated early, it compromises the animal’s welfare, causing significant economic losses. Therefore, techniques enabling early diagnosis are essential for the complete recovery of the animal(11 Motta GA, Girardi AM, Sabes AF, Portugal ES, Nociti RP, Bueno GM, Marques LC. Clinical and radiographic changes of carpi, tarsi and interphalangeal joints of beef zebu bulls on semen collection regimen. Arquivo Brasileiro de Medicina Veterinária e Zootecnia [Internet]. 2017;69(6):1357-1366. Available in: https://www.scielo.br/j/abmvz/a/3j3J4NcQkXNsdgfFFKXBNzv/?lang=en.
https://www.scielo.br/j/abmvz/a/3j3J4NcQ...
). Infrared thermography (IRT) is a technique that allows for the early detection of increased temperature caused by inflammatory processes in a fast and non-invasive manner22 Soroko M, Howell K. Infrared thermography: current applications in equine medicine. Journal of Equine Veterinary Science [Internet]. 2018;60:90-96. Available in: https://doi.org/10.1016/j.jevs.2016.11.002
https://doi.org/10.1016/j.jevs.2016.11.0...
. In cattle practice, IRT has been used to diagnose mastitis33 Metzner M, Sauter-Louis C, Seemueller A, Petzl W, Klee W. Infrared thermography of the udder surface of dairy cattle: characteristics, methods, and correlation with rectal temperature. Veterinary Journal [Internet]. 2014;199(1):57-62. Available in: https://doi.org/10.1016/j.tvjl.2013.10.030
https://doi.org/10.1016/j.tvjl.2013.10.0...
, hoof disorders44 Alsaaod M, Schaefer AL, Büscher W, Steiner A. The role of infrared thermography as a non-invasive tool for the detection of lameness in cattle. Sensors (Basel) [Internet]. 2015;15(6):14513-14525. Available in: https://doi.org/10.3390/s150614513
https://doi.org/10.3390/s150614513...
, pneumonia55 Schaefer AL, Cook NJ, Church JS, Basarab J, Perry B, Miller C, Tong AKW. The use of infrared thermography as an early indicator of bovine respiratory disease complex in calves. Research in Veterinary Science [Internet]. 2007;83(3):376-384. Available in: https://doi.org/10.1016/j.rvsc.2007.01.008
https://doi.org/10.1016/j.rvsc.2007.01.0...
, and omphalitis66 Shecaira CL, Seino CH, Bombardelli JA, Reis GA, Fusada EJ, Azedo MR, Benesi FJ. Using thermography as a diagnostic tool for omphalitis on newborn calves. Journal of Thermal Biology [Internet]. 2018;71:209-211. Available in: https://doi.org/10.1016/j.jtherbio.2017.11.014
https://doi.org/10.1016/j.jtherbio.2017....
. Although IRT has a wide application field, several technical recommendations must be followed during the examination to minimize variations in the ambient temperature and to prevent other factors from interfering with the interpretation of the results(22 Soroko M, Howell K. Infrared thermography: current applications in equine medicine. Journal of Equine Veterinary Science [Internet]. 2018;60:90-96. Available in: https://doi.org/10.1016/j.jevs.2016.11.002
https://doi.org/10.1016/j.jevs.2016.11.0...
,77 Basile R.C, Basile M.T, Albernaz R.M, Pereira M.C, Araújo R., Ferraz G.C, Queiroz-Neto A. Guia prático para o exame termográfico em equinos. Revista Brasileira de Medicina Equina. 2010;31(1):1-4.,88 Westermann S, Stanek C, Schramel JP, Ion A, Buchner HHF. The effect of airflow on thermographically determined temperature of the distal forelimb of the horse. Equine Veterinary Journal [Internet]. 2012;45(5):637-641. Available in: https://doi.org/10.1111/evj.12019
https://doi.org/10.1111/evj.12019...
).
The use of IRT in clinical practice is limited by the challenge of obtaining a mean temperature that is representative of the evaluated area as a thermographic image can comprise more than 1280 × 1024 pixels, each with a temperature value(99 Formenti D, Ludwig N, Rossi A, Trecroci A, Alberti G, Gargano M, Merla A, Ammer K, Caumo A. Skin temperature evaluation by infrared thermography: comparison of two image analysis methods during the nonsteady state induced by physical exercise. Infrared Physics and Technology [Internet]. 2017;81:32-40. Available in: https://doi.org/10.1016/j.infrared.2016.12.009
https://doi.org/10.1016/j.infrared.2016....
). Computer programs support different methods for choosing the anatomical region of interest (ROI), with each evaluation method generating different temperature means. Therefore, the choice of the method used to obtain the mean temperature of the evaluated region is fundamental for an accurate examination(22 Soroko M, Howell K. Infrared thermography: current applications in equine medicine. Journal of Equine Veterinary Science [Internet]. 2018;60:90-96. Available in: https://doi.org/10.1016/j.jevs.2016.11.002
https://doi.org/10.1016/j.jevs.2016.11.0...
,1010 Ludwig N, Formenti D, Gargano M, Alberti G. Skin temperature evaluation by infrared thermography: Comparison of image analysis methods. Infrared Physics and Technology [Internet]. 2014;62:1.-6. Available in: https://doi.org/10.1016/j.infrared.2013.09.011
https://doi.org/10.1016/j.infrared.2013....
,1111 Vardasca R, Ring EFJ, Plassmann P, Jones CD. Thermal symmetry of the upper and lower extremities in healthy subjects. Thermology International. 2012;22(2):53-60. Available in: https://www.researchgate.net/publication/227860586_Termal_symmetry_of_the_upper_and_lower_extremities_in_healthy_subjects
https://www.researchgate.net/publication...
). Methods of thermographic image analysis for the evaluation of the human skin temperature have been studied(99 Formenti D, Ludwig N, Rossi A, Trecroci A, Alberti G, Gargano M, Merla A, Ammer K, Caumo A. Skin temperature evaluation by infrared thermography: comparison of two image analysis methods during the nonsteady state induced by physical exercise. Infrared Physics and Technology [Internet]. 2017;81:32-40. Available in: https://doi.org/10.1016/j.infrared.2016.12.009
https://doi.org/10.1016/j.infrared.2016....
,1010 Ludwig N, Formenti D, Gargano M, Alberti G. Skin temperature evaluation by infrared thermography: Comparison of image analysis methods. Infrared Physics and Technology [Internet]. 2014;62:1.-6. Available in: https://doi.org/10.1016/j.infrared.2013.09.011
https://doi.org/10.1016/j.infrared.2013....
); however, we did not find studies that compared methods for assessing the temperature of cattle. Moreover, there have been no studies on the thermal symmetry of the limbs of healthy bovines. This parameter can be characterized as the temperature difference between two contralateral regions of the body, which are identical in shape, size, and position(1111 Vardasca R, Ring EFJ, Plassmann P, Jones CD. Thermal symmetry of the upper and lower extremities in healthy subjects. Thermology International. 2012;22(2):53-60. Available in: https://www.researchgate.net/publication/227860586_Termal_symmetry_of_the_upper_and_lower_extremities_in_healthy_subjects
https://www.researchgate.net/publication...
).
This study aimed to compare three thermographic image processing methods in evaluating the carpal temperature of healthy calves. Furthermore, we aimed to evaluate the thermal symmetry between the contralateral carpi in healthy calves.
Material and methods
Animals
This study was conducted after approval by the Ethics Committee on the Use of Animals at Federal University Goiás (UFG) (approval number, 015/18). Eight healthy male Holstein calves aged between 20 and 45 days, without lameness, and weighing 38.65 ± 2.27 kg were used in this study. The animals were kept in individual stalls at the Experimental Farm of the Dairy Cattle of the UFG, in the municipality of Goiânia (Goiás, Brazil) and fed 2 L of milk twice daily, with access to bran concentrate and water ad libitum. The health of the calves was evaluated prior to thermographic examination through general and specific clinical examinations of the locomotor system(1212 Feitosa FLF. Semiologia veterinária: a arte do diagnóstico. 3a ed. São Paulo: Roca; 2016. 627p.).
Thermographic examination
Twenty-four hours prior to the thermographic examination, bilateral carpus trichotomy was performed using an Oster Agc® shearing machine and a No. 40 blade. Thermographic examination was performed using a FLIR® T440 thermographic camera T440 (Flir® Systems Inc., Wilsonville, Oregon, USA), with a spatial resolution of 320 × 240 pixels and sensitivity to detect thermal differences of 0.04ºC, configured with the following parameters: an emissivity of 0.98 (ε = 0.98), ambient temperature of 27°C, relative humidity of 59%, image acquisition distance of 0.5-1 m, and the rainbow option selected as the color palette. The temperature and relative humidity of the environment were measured using an Incoterm® TH50 (Incoterm®, Porto Alegre, RS, Brazil) digital thermohygrometer. The reflected temperature was determined and adjusted in each obtained image using aluminum foil, as described by Usamentiaga et al. (2014)(1313 Usamentiaga R, Venegas P, Guerediaga J, Vega L, Molleda J, Bulnes F. Infrared thermography for temperature measurement and non-destructive testing. Sensors (Basel) [Internet]. 2014;14(7):12305-12348. Available in: https://doi.org/10.3390/s140712305
https://doi.org/10.3390/s140712305...
). The animals were transferred from the stalls to an area without direct sunlight and wind, after which the carpus region was cleaned with a dry, soft cloth. The calves were kept standing for 30 min prior to examination to avoid temperature changes associated with the possible presence of moisture and with the handling during cleaning of the carpal region. Individual thermographic images of the cranial aspect of each carpus were obtained 60 cm from the camera, which was positioned 90º to the carpus. All thermographic examinations were performed sequentially over a short period of time during the morning (08:00 - 09:00 AM) to avoid the influence of sudden temperature variations and circadian cycle effects.
Thermographic image processing
Thermographic images were analyzed using the GRAYESS® IRT Analyzer 7 (Grayess® Inc., Bradenton, Florida, USA) software. The total temperature (Ttot), region-of-interest temperature (Troi), and mean maximum temperature (Tmax) were determined according to the methodology proposed by Ludwig et al.(1010 Ludwig N, Formenti D, Gargano M, Alberti G. Skin temperature evaluation by infrared thermography: Comparison of image analysis methods. Infrared Physics and Technology [Internet]. 2014;62:1.-6. Available in: https://doi.org/10.1016/j.infrared.2013.09.011
https://doi.org/10.1016/j.infrared.2013....
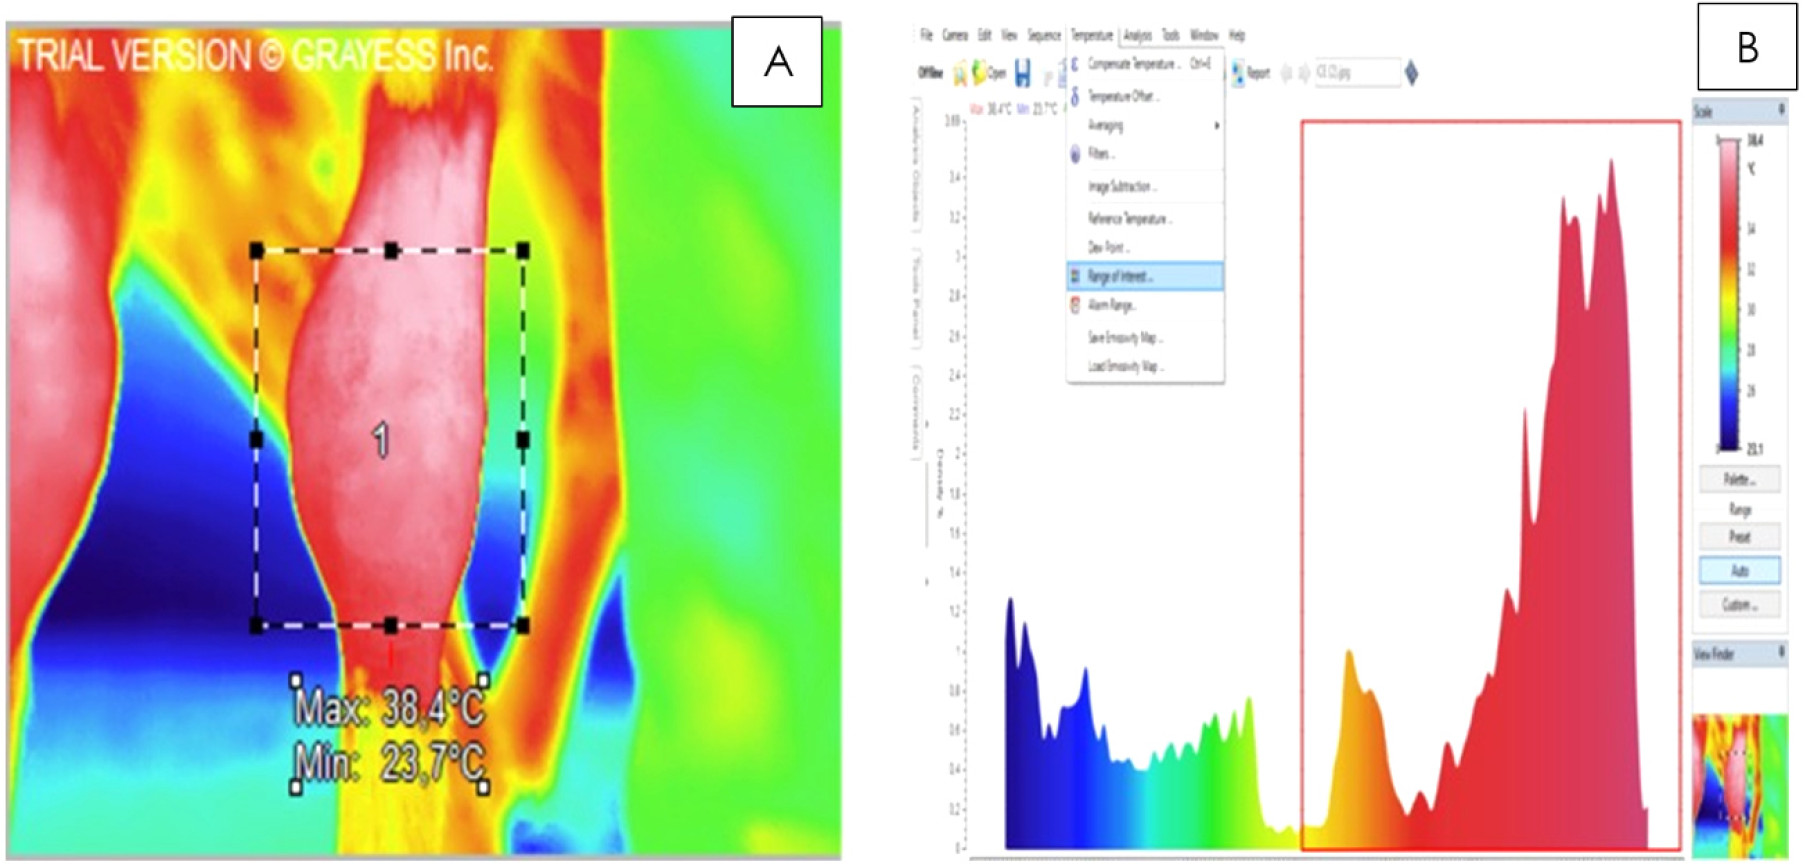
). The demarcation of the areas to be included in each thermographic image was based on the anatomy of the region, eliminating the need to use marker instruments. For the Ttot method, the geometric figure of a rectangle was applied to an area wider than the carpal region, extending from the distal radial epiphysis to the proximal metacarpal epiphysis (Figure 1A). A histogram was generated containing the temperatures identified inside the rectangle, which were represented by a colorimetric scale. In this scale blue represented lower temperatures and red represented higher temperatures. Subsequently, the temperatures corresponding to those observed in the carpus (ROI) (Figure 1A) were selected on the histogram, according to the colorimetric scale (Figure 1B). Colors that did not represent the carpal temperature (blue and green) were excluded for the Ttot calculation (Figure 1B). Ttot was determined through the arithmetic mean of the temperatures selected in the histogram.

(A) Thermography image processed by the total temperature (Ttot) method. The geometric figure of a rectangle was applied to an area wider than the carpal region (region of interest), extending from the distal radial epiphysis to the proximal metacarpal epiphysis. (B) Histogram of the temperatures identified in Figure 1A. The temperatures selected in the red rectangle correspond to those observed in the carpus.
For the Tmax method, a rectangle was applied to an area wider than the carpus (ROI), as described for the Ttot. The software was programmed to detect the five pixels of the highest temperature in the rectangle at a minimum distance of five pixels from each other. The representative carpal temperature was calculated by averaging the temperature over an area of 5 × 5 pixels around the hottest pixels identified by the software (Figure 2A). For the Troi method, an elliptical figure was applied and adjusted to the carpal region (ROI), with the upper margin limited to the distal region of the radius, the lower margin limited to the proximal region of the metacarpal, and the lateral and medial margins limited to the lateral and medial borders of the carpus, respectively (Figure 2B). Troi final temperature was determined as the arithmetic mean of the temperature within the elliptical figure.

(A) Thermographic image processed by the mean maximum temperature (Tmax) method showing the five hottest carpal spots selected automatically by the analysis software. (B) Thermographic image processed by the region-of-interest temperature (Troi) method demonstrating the use of an ellipse to delimit the carpus as the region of interest.
Statistical analysis
The obtained data were tabulated and tested for homoscedasticity and normality using Levene's and Shapiro-Wilk tests, respectively, with SAS software (version 8.0; SAS Institute, Inc., Cary, NC). The effect of the thermographic image processing method on the carpal temperature and the difference between the temperatures of the right and left carpi (∆r-l) were evaluated by analysis of variance in a general linear model using Proc GLM in the SAS software, followed by the Tukey test; p-values < 0.01 were considered significant. The Pearson's correlation coefficient (r) between the right and left carpal temperatures was also obtained for each of the three processing methods; p-values < 0.01 were considered significant. To classify the degree of correlation, the following parameters were used: weak when 0 < r < 0.4, moderate when 0.4 < r < 0.7, and strong when 0.7 < r < 1.0. Additionally, the confidence interval for the thermal symmetry between the contralateral carpus at the 99% level was calculated based on the mean and standard deviation of ∆r-l.
Results and discussion
There were no differences between temperatures obtained by the Troi and Ttot methods; however, the Tmax method resulted in significantly higher temperatures (p < 0.01) compared to the other methods (Table 1 and Figure 3). There were no differences between the temperatures of the right and left carpi within each evaluated method (Ttot, p = 0.31; Troi, p = 0.58; Tmax, p = 0.45) (Table 1).
Mean temperature, thermal symmetry between right and left carpi (∆r-l), and Pearson's correlation coefficient (r) between the temperatures of the right and left carpi in healthy calves according to the thermographic image processing method

Means and standard errors of the right and left carpal temperatures in healthy calves according to thermographic image processing method.
The absence of a difference between Troi and Ttot indicates that the two methods are equivalent for evaluating calves’ carpal temperature. This is due to the two methods using the arithmetic mean of the temperature of all pixels in the selected area. In the methodology used for Ttot, the exclusion of pixels outside the anatomical ROI was performed using the histogram of image temperatures (Figure 1B), resulting in mean temperatures matching those found for Troi. As expected, the Tmax method showed significantly higher mean temperatures compared to those for Ttot and Troi, as the temperature of the ROI was calculated by the arithmetic mean of the five hottest points in the evaluated region.
Our results are similar to those of Ludwig et al.(1010 Ludwig N, Formenti D, Gargano M, Alberti G. Skin temperature evaluation by infrared thermography: Comparison of image analysis methods. Infrared Physics and Technology [Internet]. 2014;62:1.-6. Available in: https://doi.org/10.1016/j.infrared.2013.09.011
https://doi.org/10.1016/j.infrared.2013....
), who compared the performance of these three methods in the thermographic evaluation of calf skin in humans. According to these authors, the Troi method allows for the assessment of the temperature from large areas of the body, which may have anatomical differences that influence skin temperature, such as superficial irregularities and the presence of underlying fat or muscle tissue. Consequently, large thermal variations can occur within the area evaluated in the Troi method, generating temperature distribution outside the normality curve (Gauss curve)(1010 Ludwig N, Formenti D, Gargano M, Alberti G. Skin temperature evaluation by infrared thermography: Comparison of image analysis methods. Infrared Physics and Technology [Internet]. 2014;62:1.-6. Available in: https://doi.org/10.1016/j.infrared.2013.09.011
https://doi.org/10.1016/j.infrared.2013....
). This large thermal variation in large areas can be minimized using the Ttot method, which allows the removal of temperatures outside the area of interest, as shown in Figure 1. In clinical practice, the use of the Ttot method can be advantageous when the region to be evaluated has not been adequately prepared, such as the presence of dirt in the ROI.
The Tmax method has the advantage of calculating the representative temperature of the region based on the same number of pixels, regardless of anatomical variations and temperature heterogeneity in the region evaluated1414 Ludwig N, Gargano M, Formenti D, Bruno D, Ongaro L, Alberti G. Breathing training characterization by termal imaging: a case study. Acta of Bioengineering and Biomechanics [Internet]. 2012;14(3):41-47. Available in: https://pubmed.ncbi.nlm.nih.gov/23140359/
https://pubmed.ncbi.nlm.nih.gov/23140359...
. This last aspect is especially important in the evaluation of ROIs in warmer areas due to the distribution of cutaneous blood vessels or inflammation99 Formenti D, Ludwig N, Rossi A, Trecroci A, Alberti G, Gargano M, Merla A, Ammer K, Caumo A. Skin temperature evaluation by infrared thermography: comparison of two image analysis methods during the nonsteady state induced by physical exercise. Infrared Physics and Technology [Internet]. 2017;81:32-40. Available in: https://doi.org/10.1016/j.infrared.2016.12.009
https://doi.org/10.1016/j.infrared.2016....
. Therefore, the Tmax method seems to be more suitable for evaluating temperatures during physical activity or pathological thermal patterns(1010 Ludwig N, Formenti D, Gargano M, Alberti G. Skin temperature evaluation by infrared thermography: Comparison of image analysis methods. Infrared Physics and Technology [Internet]. 2014;62:1.-6. Available in: https://doi.org/10.1016/j.infrared.2013.09.011
https://doi.org/10.1016/j.infrared.2013....
).
For each of the three image processing methods, there was a significant and strong correlation (p < 0.01 and 0.7 < r < 1.0) between the temperatures of the right and left carpi in healthy calves. This result can be explained by the low variation in the age of animals (20 to 45 days) and the similarity of physical effort, which preclude the occurrence of unilateral temperature variations in the limbs(1010 Ludwig N, Formenti D, Gargano M, Alberti G. Skin temperature evaluation by infrared thermography: Comparison of image analysis methods. Infrared Physics and Technology [Internet]. 2014;62:1.-6. Available in: https://doi.org/10.1016/j.infrared.2013.09.011
https://doi.org/10.1016/j.infrared.2013....
). Tmax presented the highest correlation coefficient (r = 0.99), indicating that this method has greater sensitivity to compare temperatures of healthy contralateral anatomical regions, allowing the identification of small thermal variations. In clinical practice, use of the Tmax method may represent an interesting technique for the early diagnosis of inflammatory processes. Contrary to the results of the present study, Ludwig et al.(1010 Ludwig N, Formenti D, Gargano M, Alberti G. Skin temperature evaluation by infrared thermography: Comparison of image analysis methods. Infrared Physics and Technology [Internet]. 2014;62:1.-6. Available in: https://doi.org/10.1016/j.infrared.2013.09.011
https://doi.org/10.1016/j.infrared.2013....
) found a lower correlation coefficient for the Tmax method than for the Troi and Ttot. This difference may be associated with the population and anatomical region evaluated, since that study(1010 Ludwig N, Formenti D, Gargano M, Alberti G. Skin temperature evaluation by infrared thermography: Comparison of image analysis methods. Infrared Physics and Technology [Internet]. 2014;62:1.-6. Available in: https://doi.org/10.1016/j.infrared.2013.09.011
https://doi.org/10.1016/j.infrared.2013....
) compared the calf skin temperature of men and women aged between 15 and 45 years old, who performed different levels of physical activity. Therefore, theses authors may have found a higher thermal difference between the skin of the contralateral calves due to unilateral blood flow changes caused by injuries, pathological conditions(1515 Eliason G, Abdel-Halim SM, Piehl-Aulin K, Kadi F. Alterations in the muscle-to-capillary interface in patients with different degrees of chronic obstructive pulmonary disease. Respiratory Research [Internet]. 2010;11(15):97. Available in: https://doi.org/10.1186/1465-9921-11-97
https://doi.org/10.1186/1465-9921-11-97...
) and training level(1616 Jensen L, Bangsbo J, Hellsten Y. Effect of high intensity training on capillarization and presence of angiogenic factors in human skeletal muscle. Journal of Physiology [Internet]. 2004;557(Pt2):571-582. Available in: https://doi.org/10.1113/jphysiol.2003.057711
https://doi.org/10.1113/jphysiol.2003.05...
).
There were no differences among the evaluated processing methods in terms of the difference in temperature between the right and left carpi (∆r-l) (Table 1). Moreover, it was found that the 99% confidence interval for ∆r-l was 0.03 to 0.26 °C, which represents the variation in thermal symmetry between the contralateral carpi of healthy calves under the conditions of this study. In this context, no studies were found in cattle that establish physiological patterns of temperature variation between contralateral joints. It is expected that healthy contralateral anatomical structures under similar environmental conditions present small temperature variations, as observed in humans(99 Formenti D, Ludwig N, Rossi A, Trecroci A, Alberti G, Gargano M, Merla A, Ammer K, Caumo A. Skin temperature evaluation by infrared thermography: comparison of two image analysis methods during the nonsteady state induced by physical exercise. Infrared Physics and Technology [Internet]. 2017;81:32-40. Available in: https://doi.org/10.1016/j.infrared.2016.12.009
https://doi.org/10.1016/j.infrared.2016....
,1111 Vardasca R, Ring EFJ, Plassmann P, Jones CD. Thermal symmetry of the upper and lower extremities in healthy subjects. Thermology International. 2012;22(2):53-60. Available in: https://www.researchgate.net/publication/227860586_Termal_symmetry_of_the_upper_and_lower_extremities_in_healthy_subjects
https://www.researchgate.net/publication...
), dogs(1717 Infernuso T, Loughin CA, Marino DJ, Umbaugh SE, Solt PS. Thermal imaging of normal and cranial cruciate ligament-deficient stifles in dogs. Veterinary Surgery [Internet]. 2010;39(4):410-417. Available in: https://doi.org/10.1111/j.1532-950X.2010.00677.x
https://doi.org/10.1111/j.1532-950X.2010...
) and horses(1818 Soroko M, Henklewski R, Filipowski H, Jodkowska E. The effectiveness of thermographic analysis in equine orthopedics. Journal of Equine Veterinary Science [Internet]. 2013;33(9):760-762. Available in: http://dx.doi.org/10.1016/j.jevs.2012.11.009
http://dx.doi.org/10.1016/j.jevs.2012.11...
). Knowing the thermal symmetry between contralateral joints is essential to identify temperature variations that exceed these limits, which may indicate pathological processes(1111 Vardasca R, Ring EFJ, Plassmann P, Jones CD. Thermal symmetry of the upper and lower extremities in healthy subjects. Thermology International. 2012;22(2):53-60. Available in: https://www.researchgate.net/publication/227860586_Termal_symmetry_of_the_upper_and_lower_extremities_in_healthy_subjects
https://www.researchgate.net/publication...
). Therefore, this result can be useful for future research on thermal symmetry of the carpal joint of healthy calves for the early diagnosis of joint pathological processes.
Conclusions
The Troi and Ttot thermographic image processing methods generate similar temperatures in the evaluation of the carpus in healthy calves; however, the Tmax method generates higher temperatures. The three methods provide representative temperatures and high correlation between the right and left carpi in these animals. However, Tmax has greater accuracy to detect small temperature variations between the contralateral carpus, due to its higher correlation coefficient. Furthermore, the thermal symmetry between the contralateral carpi of healthy calves varies between 0.03 and 0.26ºC.
Acknowledgments
We are grateful for the support of the School of Veterinary and Zootechnics of the Federal University of Goiás and Capes for providing the support and structure for this research to be carried out, and for the support of IF Goiano, which through the process 23219.000175.2021-08 provided resources so that this work could be translated.
References
-
1Motta GA, Girardi AM, Sabes AF, Portugal ES, Nociti RP, Bueno GM, Marques LC. Clinical and radiographic changes of carpi, tarsi and interphalangeal joints of beef zebu bulls on semen collection regimen. Arquivo Brasileiro de Medicina Veterinária e Zootecnia [Internet]. 2017;69(6):1357-1366. Available in: https://www.scielo.br/j/abmvz/a/3j3J4NcQkXNsdgfFFKXBNzv/?lang=en
» https://www.scielo.br/j/abmvz/a/3j3J4NcQkXNsdgfFFKXBNzv/?lang=en -
2Soroko M, Howell K. Infrared thermography: current applications in equine medicine. Journal of Equine Veterinary Science [Internet]. 2018;60:90-96. Available in: https://doi.org/10.1016/j.jevs.2016.11.002
» https://doi.org/10.1016/j.jevs.2016.11.002 -
3Metzner M, Sauter-Louis C, Seemueller A, Petzl W, Klee W. Infrared thermography of the udder surface of dairy cattle: characteristics, methods, and correlation with rectal temperature. Veterinary Journal [Internet]. 2014;199(1):57-62. Available in: https://doi.org/10.1016/j.tvjl.2013.10.030
» https://doi.org/10.1016/j.tvjl.2013.10.030 -
4Alsaaod M, Schaefer AL, Büscher W, Steiner A. The role of infrared thermography as a non-invasive tool for the detection of lameness in cattle. Sensors (Basel) [Internet]. 2015;15(6):14513-14525. Available in: https://doi.org/10.3390/s150614513
» https://doi.org/10.3390/s150614513 -
5Schaefer AL, Cook NJ, Church JS, Basarab J, Perry B, Miller C, Tong AKW. The use of infrared thermography as an early indicator of bovine respiratory disease complex in calves. Research in Veterinary Science [Internet]. 2007;83(3):376-384. Available in: https://doi.org/10.1016/j.rvsc.2007.01.008
» https://doi.org/10.1016/j.rvsc.2007.01.008 -
6Shecaira CL, Seino CH, Bombardelli JA, Reis GA, Fusada EJ, Azedo MR, Benesi FJ. Using thermography as a diagnostic tool for omphalitis on newborn calves. Journal of Thermal Biology [Internet]. 2018;71:209-211. Available in: https://doi.org/10.1016/j.jtherbio.2017.11.014
» https://doi.org/10.1016/j.jtherbio.2017.11.014 -
7Basile R.C, Basile M.T, Albernaz R.M, Pereira M.C, Araújo R., Ferraz G.C, Queiroz-Neto A. Guia prático para o exame termográfico em equinos. Revista Brasileira de Medicina Equina. 2010;31(1):1-4.
-
8Westermann S, Stanek C, Schramel JP, Ion A, Buchner HHF. The effect of airflow on thermographically determined temperature of the distal forelimb of the horse. Equine Veterinary Journal [Internet]. 2012;45(5):637-641. Available in: https://doi.org/10.1111/evj.12019
» https://doi.org/10.1111/evj.12019 -
9Formenti D, Ludwig N, Rossi A, Trecroci A, Alberti G, Gargano M, Merla A, Ammer K, Caumo A. Skin temperature evaluation by infrared thermography: comparison of two image analysis methods during the nonsteady state induced by physical exercise. Infrared Physics and Technology [Internet]. 2017;81:32-40. Available in: https://doi.org/10.1016/j.infrared.2016.12.009
» https://doi.org/10.1016/j.infrared.2016.12.009 -
10Ludwig N, Formenti D, Gargano M, Alberti G. Skin temperature evaluation by infrared thermography: Comparison of image analysis methods. Infrared Physics and Technology [Internet]. 2014;62:1.-6. Available in: https://doi.org/10.1016/j.infrared.2013.09.011
» https://doi.org/10.1016/j.infrared.2013.09.011 -
11Vardasca R, Ring EFJ, Plassmann P, Jones CD. Thermal symmetry of the upper and lower extremities in healthy subjects. Thermology International. 2012;22(2):53-60. Available in: https://www.researchgate.net/publication/227860586_Termal_symmetry_of_the_upper_and_lower_extremities_in_healthy_subjects
» https://www.researchgate.net/publication/227860586_Termal_symmetry_of_the_upper_and_lower_extremities_in_healthy_subjects -
12Feitosa FLF. Semiologia veterinária: a arte do diagnóstico. 3a ed. São Paulo: Roca; 2016. 627p.
-
13Usamentiaga R, Venegas P, Guerediaga J, Vega L, Molleda J, Bulnes F. Infrared thermography for temperature measurement and non-destructive testing. Sensors (Basel) [Internet]. 2014;14(7):12305-12348. Available in: https://doi.org/10.3390/s140712305
» https://doi.org/10.3390/s140712305 -
14Ludwig N, Gargano M, Formenti D, Bruno D, Ongaro L, Alberti G. Breathing training characterization by termal imaging: a case study. Acta of Bioengineering and Biomechanics [Internet]. 2012;14(3):41-47. Available in: https://pubmed.ncbi.nlm.nih.gov/23140359/
» https://pubmed.ncbi.nlm.nih.gov/23140359/ -
15Eliason G, Abdel-Halim SM, Piehl-Aulin K, Kadi F. Alterations in the muscle-to-capillary interface in patients with different degrees of chronic obstructive pulmonary disease. Respiratory Research [Internet]. 2010;11(15):97. Available in: https://doi.org/10.1186/1465-9921-11-97
» https://doi.org/10.1186/1465-9921-11-97 -
16Jensen L, Bangsbo J, Hellsten Y. Effect of high intensity training on capillarization and presence of angiogenic factors in human skeletal muscle. Journal of Physiology [Internet]. 2004;557(Pt2):571-582. Available in: https://doi.org/10.1113/jphysiol.2003.057711
» https://doi.org/10.1113/jphysiol.2003.057711 -
17Infernuso T, Loughin CA, Marino DJ, Umbaugh SE, Solt PS. Thermal imaging of normal and cranial cruciate ligament-deficient stifles in dogs. Veterinary Surgery [Internet]. 2010;39(4):410-417. Available in: https://doi.org/10.1111/j.1532-950X.2010.00677.x
» https://doi.org/10.1111/j.1532-950X.2010.00677.x -
18Soroko M, Henklewski R, Filipowski H, Jodkowska E. The effectiveness of thermographic analysis in equine orthopedics. Journal of Equine Veterinary Science [Internet]. 2013;33(9):760-762. Available in: http://dx.doi.org/10.1016/j.jevs.2012.11.009
» http://dx.doi.org/10.1016/j.jevs.2012.11.009
Publication Dates
-
Publication in this collection
13 May 2022 -
Date of issue
2022
History
-
Received
19 Oct 2021 -
Accepted
20 Jan 2022 -
Published
06 Apr 2022


 AB Different capital letters indicate a statistical difference by the Tukey test (p < 0.01).